Understanding USDA Plant Hardiness Zones

About USDA Plant Hardiness Zones
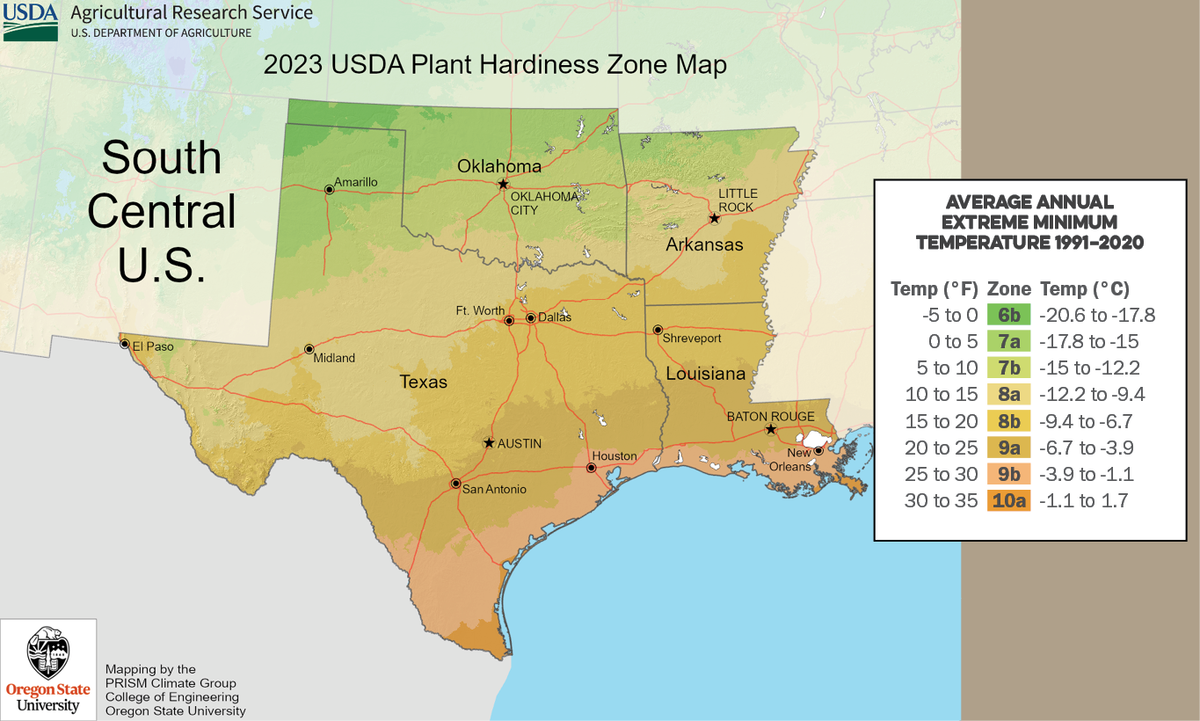
The USDA Plant Hardiness Zone Map is the standard by which gardeners and growers can determine which perennial plants are most likely to thrive at a location, based on the average annual
extreme minimum winter temperature, displayed as 10° F zones and 5° F half zones.
extreme minimum winter temperature, displayed as 10° F zones and 5° F half zones.
Light: To thrive, plants need to be planted where they will receive the proper amount of light. For example, plants that require partial shade that are at the limits of hardiness in your area might be injured by too much sun during the winter because it might cause rapid changes in the plant’s internal temperature.
Soil Moisture: Plants have different requirements for soil moisture, and this might vary seasonally. Plants that might otherwise be hardy in your zone might be injured if soil moisture is too dry in late autumn, and if they enter dormancy while suffering moisture stress.
Temperature: Plants grow best within a range of optimal temperatures, both cold and hot. That range may be wide for some varieties and species but narrow for others. Many frost-tender plants are grown as seasonal annuals in all zones. Our signs note these varieties as “tender perennials grown as annuals”.
Duration of exposure to cold: Many plants that can survive a short period of exposure to cold may not
tolerate longer periods of cold weather.
Humidity: High relative humidity limits cold damage by reducing moisture loss from leaves, branches,
and buds.
Source: US Dept. of Agriculture
